How to Interpret the cPanel Resource Usage Dashboard

The cPanel Resource Usage dashboard tracks how much of your hosting account's server limits you use, including CPU, Physical Memory (PMem), Entry Processes (EP), and I/O. When any of them reaches 100%, the server slows your site or returns a 508 Resource Limit Is Reached error.
What the Resource Usage Dashboard Shows
Shared hosting runs on CloudLinux, which splits one physical server into isolated containers, each with a fixed allowance. Under Metrics in cPanel, the dashboard compares your usage with that allowance.
Why Reading It Matters
A slow site has several possible causes, and the dashboard shows which one. Memory points to heavy plugins, while CPU stuck at the ceiling can mean a bot hammering one page.
Decoding the Metrics
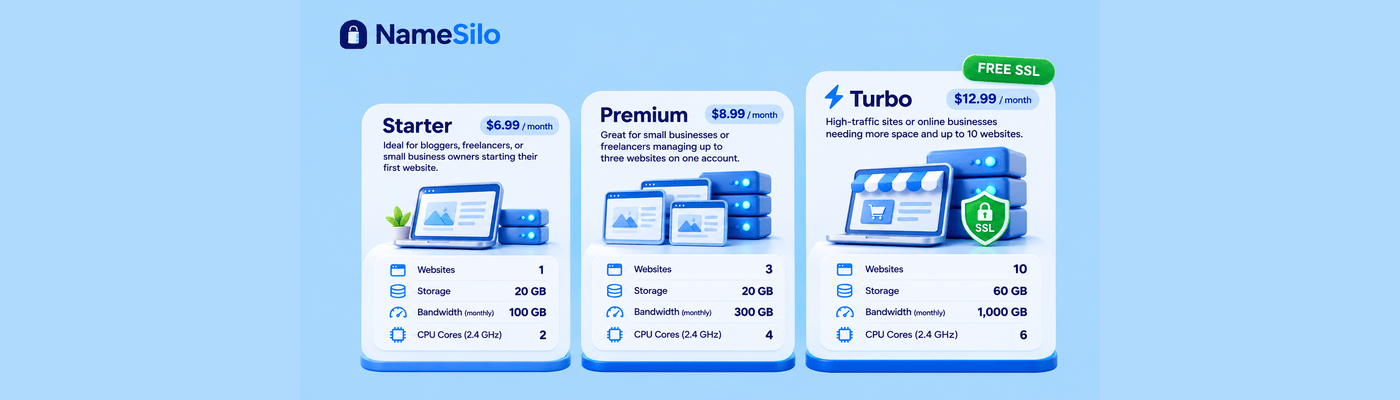
Metric | What it measures | Starter / Premium / Turbo |
CPU | Processor time your scripts use | 2 / 4 / 6 cores |
PMem | RAM your processes hold at once | 4 GB on all |
EP | Requests running PHP at the same instant | 30 / 50 / 50 |
I/O | Disk read and write speed | 2 / 6 / 30 MB/s |
IOPS | Separate disk operations per second | 32 / 128 / 384 |
Entry Processes cause the most confusion. A limit of 30 does not mean 30 visitors a day. It means 30 people running a PHP script at the same instant. Each request finishes in a fraction of a second, so that limit can serve thousands of daily visitors. Slow scripts hold slots longer.
I/O is how fast data moves on disk, and IOPS is how often.
Reading the Snapshot Graphs
On the Current Usage tab, one line shows usage and another shows your limit. Where they touch, the server throttled you. Look for the pattern:
Same hour daily: a scheduled task, such as a 2:00 AM backup plugin.
Spikes with campaigns: real traffic.
Flat line at the ceiling: a heavy plugin, missing caching, or a bot.
To find timeouts and other issues:
Note when the error happened.
In Resource Usage, set the timeframe to cover that time.
Check which resource shows faults, meaning limit hits.
Open the Snapshot tab for that moment to see processes and queries.
Open Errors under Metrics and look for "Maximum execution time of 30 seconds exceeded." Our PHP limit is 30 seconds, adjustable in your PHP settings.
Fix the slow script or query first, then raise the time limit only if needed.
Common Mistakes
Assuming a virus. Limits are usually reached through growth in visitors, plugins, and database size. Check the snapshot before reinstalling anything.
Reading EP as total visitors. It counts simultaneous requests.
Confusing PMem with PHP memory_limit. One caps your account and the other caps one script.
Upgrading before optimizing. Caching and fewer plugins may be enough.
What This Means for You
Use the dashboard to decide when to move up. Faults only during rare spikes call for optimizing, not upgrading. Limits hit during normal traffic after caching and cleanup mean it is time. Premium and Turbo both allow 50 EP, so Turbo helps disk-heavy sites more than traffic-heavy ones. For dedicated resources, a VPS is the next step. Compare allowances on our hosting page.
Frequently Asked Questions
What does physical memory mean in cPanel? The RAM your account's processes can hold at once. Our plans allow 4 GB.
Why is my cPanel resource usage high?
Traffic spikes, heavy plugins, missing caching, bots, or scheduled backups. The Snapshot tab shows which.
What is an Entry Process (EP) in hosting?
A request actively running a PHP script. A limit of 30 means 30 at once, not 30 visitors a day.
How do I fix high CPU usage in cPanel?
Enable caching, remove unused plugins, block abusive bots, and fix slow queries from the Snapshot tab.
What is I/O usage in web hosting?
Disk read and write speed, measured in MB/s. IOPS counts the separate operations per second.
Why is my website showing a 508 error?
Your account hit a resource limit, often EP, and new requests were refused. Resource Usage shows which and when.
How do I check my server limits?
Open Metrics, then Resource Usage, and compare each line with your plan's allowances.
When should I upgrade to a VPS?
When limits are hit in normal traffic after caching and cleanup, or you need dedicated resources.
NameSilo Staff
The NameSilo staff of writers worked together on this post. It was a combination of efforts from our passionate writers that produce content to educate and provide insights for all our readers.